

.avif)

Key Takeaways
- HRV measures the variation in timing between individual heartbeats, not the rate itself. A healthy heart constantly micro-adjusts, and that variability is a sign of biological readiness.
- Your autonomic nervous system shapes HRV through two branches: parasympathetic activity slows the heart and raises HRV; sympathetic activity speeds it up and lowers HRV.
- RMSSD and SDNN are the two primary HRV metrics. Never compare scores across different apps or devices since they use different math and measurement windows.
- Daily choices actively shape your HRV. Regular exercise, quality sleep, and stress management techniques like breathwork are the most effective levers for improving your baseline.
- HRV is a recognized marker of biological resilience and longevity, often signaling nervous system stress before symptoms appear.
- Track your personal trend over time rather than chasing a specific number or comparing to population averages. Your baseline is unique to your biology.
Is Your HealthTech Product Built for Success in Digital Health?
.avif)
This article is part of The Science Behind Wearables series.
To stay up to date with new posts, subscribe on Substack.
What is HRV?
TL;DR: Heart Rate Variability, or HRV for short, measures the variation of individual beats of your heart.
If you were to listen to your heart right now, you would probably expect to hear a steady, rhythmic thump-thump, thump-thump. We have been taught that "steady" means "healthy." In the health science world, we know the opposite is true. In the same way a mountain bike's suspension system adjusts to every rock and root on the trail, a healthy heart is constantly micro-adjusting. It speeds up slightly when you inhale and slows down when you exhale. This subtle "chaos" in the timings between heart beats is the signature of a body that is ready for challenges. Heart Rate Variability, or HRV for short, measures the variation of individual beats of your heart.
What shapes your HRV?
TL;DR: HRV is shaped by your autonomic nervous system, with parasympathetic branch slowing down the heart and increasing the HRV and sympathetic speeding up the heart and thus decreasing HRV.
At the core of every heart beat is a tiny cluster of cells in your heart called the Sinoatrial (SA) node. It is considered your heart's internal pacemaker and produces a steady, rhythmic rate of about 60 to 100 beats per minute. But your heart doesn't operate in a vacuum. It's constantly taking orders from your Autonomic Nervous System (ANS) with its sympathetic and parasympathetic branches. The variability we measure is the result of a constant, silent conversation between the SA node and these two branches. To visualize how they interact, think of them as the Accelerator and the Brake:
The Parasympathetic Branch (The Brake): Led by the vagus nerve, this system tells the SA node to slow down and relax. Naturally, when the beat is slower, there is more room for variations and that is when you would see higher HRV.
The Sympathetic Branch (The Accelerator): When you're under stress — physical or emotional — this branch kicks in, telling the SA node to floor it. As the heart rate increases, the sympathetic branch takes control, supporting a perfectly rhythmic pulse.
Because this conversation between your sympathetic and parasympathetic branches is constant, we don't look at HRV as a single snapshot. We look at the trend: the story of how the branches are balancing each other out over days, weeks and months.
How can HRV be calculated?
TL;DR: HRV is calculated by measuring the millisecond-level variations between consecutive heartbeats, which are then processed into metrics like RMSSD or SDNN.
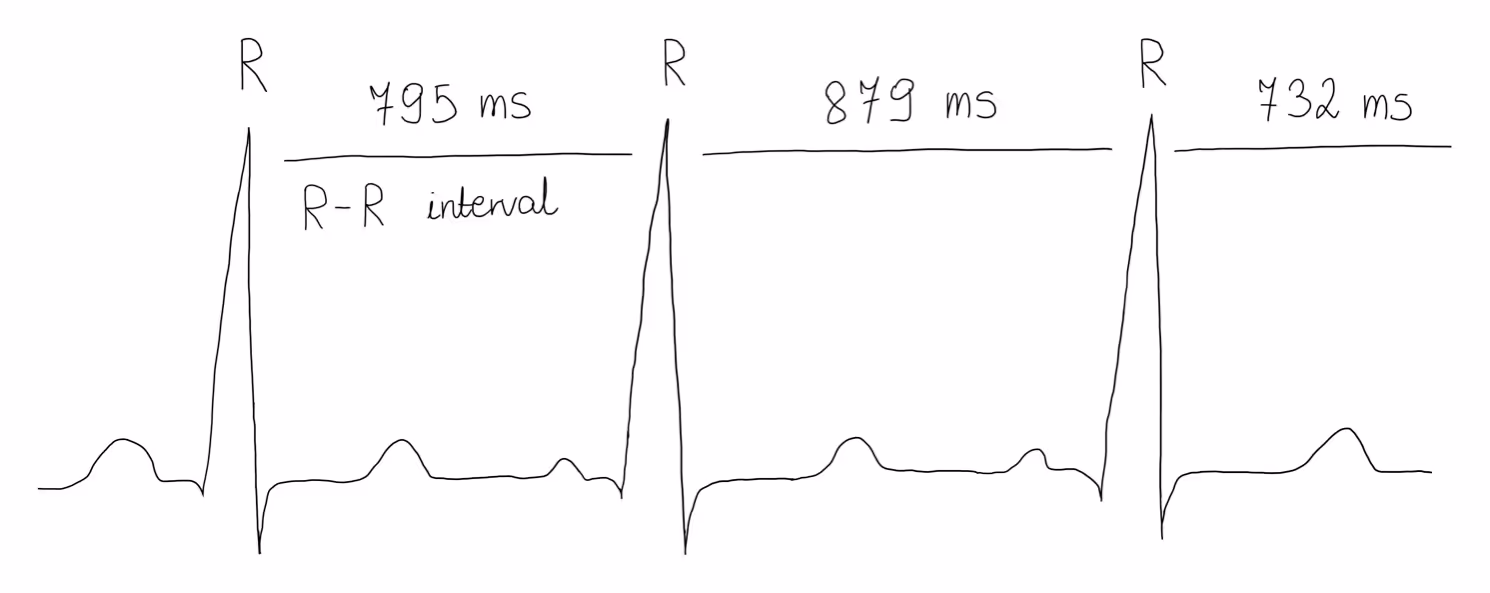
So how do we calculate HRV? When you look at your ECG (electrocardiogram) trace, you see distinct "spikes." These are called R-peaks, and they represent your heart's contractions. The time between these spikes is the R-R interval, measured in milliseconds (ms).
In order to assign meaning to these numbers, we can use different metrics to represent HRV. The two most common ones are RMSSD (root mean square of successive differences between heartbeats) and SDNN (standard deviation of normal-to-normal intervals) [1]:
Note: Because these metrics use different math and are often recorded at different times, never compare your HRV score from one app to another. The value is in the trend within a single ecosystem, not the raw number itself.
For a closer look at SDNN specifically, the article on what is SDNN and how accurately wrist-worn wearables measure it covers this metric and describes where precision breaks down in practice.
If you're a developer building health applications, understanding which wearables your users are likely wearing matters when deciding which HRV metric to surface in your product.
What influences your HRV?
TL;DR: While factors like age and genetics set your biological baseline, your HRV is primarily a reflection of your daily choices, driven by a balance of consistent exercise, quality sleep and stress management.
After learning how the nervous system regulates your heart, it might seem like you are merely a passenger in the process. However, this is far from the truth. While certain elements of your HRV are "hardwired" into your biology, many others act as "dials" you can adjust daily. Distinguishing between the two is essential for interpreting your data without discouragement. The factors beyond our control include genetics, sex, and age, as well as cardiovascular, respiratory, or psychiatric conditions [2-7].
Fortunately, there are numerous levers you can pull to actively improve your autonomic resilience. The most effective approach is regular, moderate and high intensity exercise [8]. When monitoring your values, it is important to recognize the "acute-versus-chronic" relationship: while a strenuous workout acts as a temporary stressor that drops your HRV in the short term, consistent cardiovascular training is what raises your baseline over the months. Beyond physical exercise, proactive stress management through techniques like breathwork or meditation can directly reduce sympathetic activity, thus increasing your HRV [9]. The quality and consistency of your sleep serve as the primary engine for recovery and long-term HRV improvement [10]. Finally, your immediate daily choices play a large role in your autonomic health [11-12]. In wearable data, alcohol consumption and late-night meals are the most frequent "HRV stressors," as they force the body to remain in an active, metabolic state when it should be transitioning into deep recovery. By understanding these influences, you move from simply observing your numbers to actively managing your physiological state.
These factors are especially visible when you track HRV continuously through a wearable device. For a broader look at what developers can build with this data, the article on wearable data integration use cases covers practical applications across health app categories.
Why is HRV such an important variable?
TL;DR: Beyond simple fitness tracking, HRV is a vital sign of biological resilience and systemic health; a higher, more adaptable HRV is a key indicator of longevity and your body's ability to maintain homeostasis.
Knowing what shapes your HRV is one thing, but asking why you should care is the more important question. Most people encounter HRV as a tool for athletes to measure fitness or recovery, but that's not the end of the story. In reality, HRV is a powerful indicator of your overall biological resilience. It isn't just a snapshot of yesterday's workout; it is a "dashboard light" for your health that often flickers long before you actually feel symptoms of stress or illness. This is because your HRV provides a direct window into the state of your nervous system. If you spend too much time in a "fight or flight" state, that chronic sympathetic dominance is reflected in a lower HRV, which over time is a known risk factor for cardiovascular disease. Conversely, actively strengthening your parasympathetic response builds the resilience needed to handle life's challenges without taking a permanent toll on your health.
Perhaps most importantly, HRV is a recognized marker of longevity. Because it measures how well your autonomic nervous system can adapt to challenges, a higher age-adjusted HRV is consistently associated with a longer, healthier life as well as a lower risk of chronic metabolic and cardiovascular decline. By supporting your body's ability to remain adaptable, you aren't just optimizing for the next 24 hours: you are preserving a physiological resilience that is fundamental to a healthier lifespan.
For health app developers, HRV is one of the most valuable signals available from wearable device integrations, bridging raw sensor data and meaningful health intelligence in a way few other metrics can.
Lessons Learned: Finding Your Personal Balance
TL;DR: The goal of tracking HRV isn't to achieve a specific "high score," but to understand your personal trends; because your baseline is unique to your biology, the real value lies in monitoring how your autonomic balance shifts in response to your specific environment and lifestyle.
When interpreting your own HRV, the most important takeaway is that balance is the key. While the sympathetic and parasympathetic branches have opposite roles, they are not competitors; they are complementary systems that work in tandem to maintain your internal homeostasis. As we have learned, HRV is a highly sensitive metric influenced by a complex set of variables, ranging from genetics and age to hormonal cycles, psychological state, and lifestyle choices. This sensitivity is precisely why population-wide averages are rarely useful for the individual. Instead of comparing your values to a general population, the true value of this data lies in understanding your own trends. By tracking your personal baseline over time, you move away from chasing a specific score and toward a deeper understanding of how your body responds to the world around you.
If you're building a health application that surfaces HRV or recovery data, Open Wearables provides unified access to HRV, sleep, and activity data across Garmin, WHOOP, Oura, Apple Health, and more through a single open-source API. You can also explore what happens when millions of health measurements have no structured home, and why that's the problem Open Wearables was built to solve.
References
- Shaffer, F., & Ginsberg, J. P. (2017). An Overview of Heart Rate Variability Metrics and Norms. Frontiers in Public Health, 5(258).
- Golosheykin et al. (2017). Genetic influences on heart rate variability. International Journal of Psychophysiology.
- De Meersman, R. E., & Stein, P. K. (2007). Vagal modulation and aging. Biological Psychology.
- Koenig, J. and Thayer, J.F. (2016). Sex differences in healthy human heart rate variability. Neuroscience & Biobehavioral Reviews.
- Wang, B.X. et al. (2026). Heart rate variability in cardiovascular disease. Frontiers in Cardiovascular Medicine.
- Alqahtani et al. (2023). Heart rate variability in COPD. Frontiers in Cardiovascular Medicine.
- Wang, Z. et al. (2025). Heart rate variability in mental disorders. Translational Psychiatry.
- Grässler et al. (2021). Effects of Different Training Interventions on HRV. Frontiers in Physiology.
- Natarajan, A. (2023). Heart rate variability during mindful breathing meditation. Frontiers in Physiology.
- Zhang, S. et al. (2025). Effects of sleep deprivation on heart rate variability. Frontiers in Neurology.
- Santa-Rosa et al. (2020). Impact of an active lifestyle on HRV. Scientific Reports.
- Damoun et al. (2024). Heart rate variability measurement and influencing factors. Global Cardiology Science and Practice.
Frequently Asked Questions
The most effective levers for improving HRV are consistent aerobic and high-intensity exercise, quality sleep, and active stress management. Regular cardiovascular training raises your baseline over weeks and months, even though an individual hard workout will temporarily lower your HRV. Sleep is the primary recovery engine — poor or insufficient sleep is one of the fastest ways to suppress HRV. Techniques like slow breathing, meditation, and breathwork directly reduce sympathetic nervous system activity and support parasympathetic tone. Avoiding alcohol and late-night meals also helps, as both force metabolic activity during recovery windows.
A low HRV score relative to your personal baseline typically indicates that your sympathetic nervous system is dominant — your body is in a stressed, reactive state rather than a recovered one. This can be caused by poor sleep, alcohol, illness, intense training load, psychological stress, or early signs of overtraining. Chronically low HRV is also associated with increased cardiovascular risk and reduced resilience. A single low reading is rarely cause for concern, but a sustained downward trend warrants attention to sleep, stress, and recovery habits.
Exercise has a dual relationship with HRV: in the short term, a hard workout acts as a stressor and will lower your HRV for 24 to 48 hours as your body recovers. In the long term, consistent cardiovascular and high-intensity training raises your HRV baseline over weeks and months by strengthening parasympathetic tone and improving the heart's efficiency. This is why athletes often have higher resting HRV than sedentary individuals. The key is reading short-term drops as normal recovery signals rather than alarm, while tracking the upward baseline trend as evidence that training is working.


.png)
.avif)
